
Unlock the potential of your Facebook groups with our comprehensive 5-stage benchmarking approach. Whether you're looking to boost business development, foster a dynamic community, or delve into research, understanding the performance of your groups is crucial. This article guides you through the key steps of effective Facebook group benchmarking, helping you identify high-performing groups, understand engagement levels, pinpoint strengths, and strategize for competitive advantage and growth.
1. Choose groups
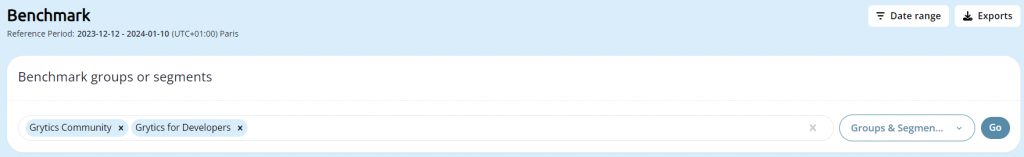
The initial step in Facebook group benchmarking involves selecting the groups you manage. This selection is crucial for an effective benchmark. Start by comparing diverse groups, such as school or university groups, to gauge varying engagement levels among different classes. Similarly, assess business groups across various regions to determine engagement variations by area. Also, evaluate the activity levels of advocacy groups focusing on similar topics. For convenience, group all your managed groups in one location for easier analysis.
When choosing groups, consider factors like the group's inception date, as this can significantly influence engagement and activity levels. It's insightful to include groups with varying histories and sizes in your analysis to understand how longevity and group size affect performance.
To begin the benchmarking process, simply click the 'Benchmark' button located at the top of your screen.
2. Select the time range
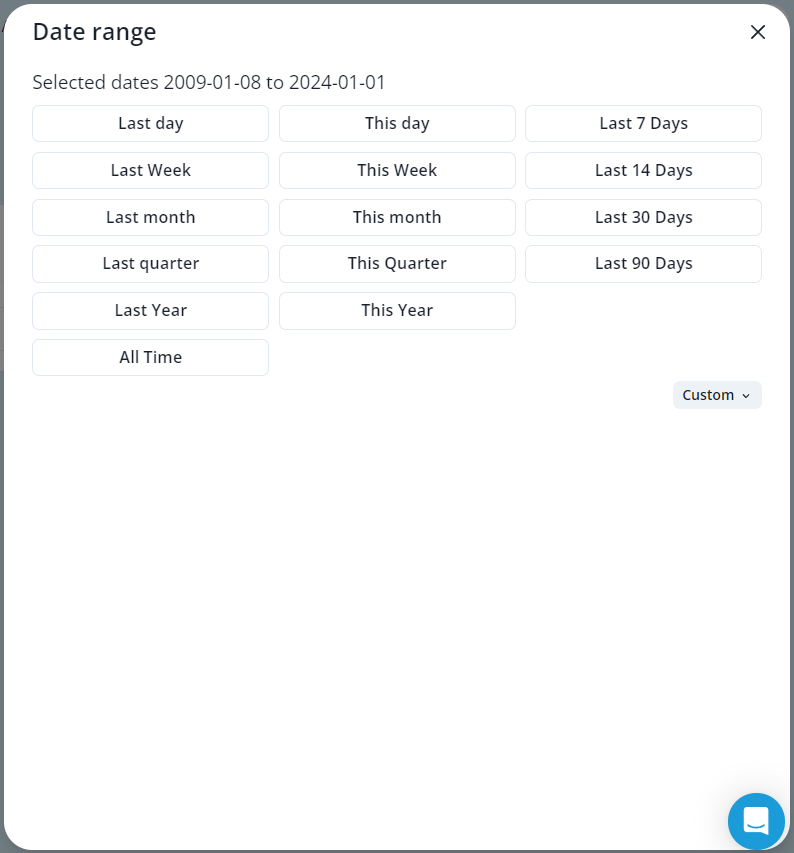
Once you've selected your groups, the next step is choosing the appropriate time range. This is done easily with a button located in the top right corner of your dashboard.
The time range you select is pivotal in shaping your benchmark results. Options range from the last 7, 14, 31, to 90 days, enabling you to analyze Key Performance Indicators (KPIs) over different durations - weekly, bi-weekly, monthly, or quarterly. For more tailored insights, you can opt for a custom time frame, like an academic year, a specific marketing campaign period, or around a particular event, to pinpoint which group excelled. Additionally, you have the option to evaluate groups over their entire lifespan, from creation to the present.
By experimenting with various time ranges, you gain valuable perspectives on group performance, both in the short term and over longer periods.
3. Identify the most performing groups and understand why
Engagement & Activity analysis
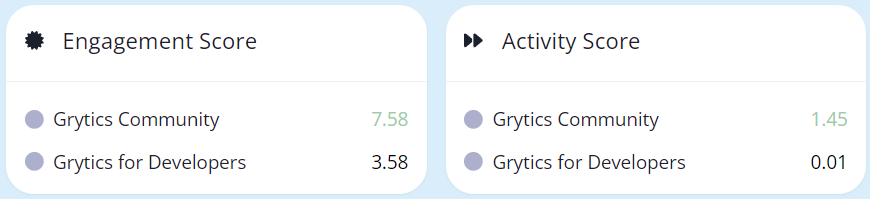
When you begin your analysis in the Benchmark, the first aspect you'll notice is the performance of groups based on their engagement and activity levels. Groups with higher engagement scores often show greater resonance with each post, while those with higher activity scores typically have more frequent posts and interactions daily.
In the key metrics comparison chart, you can simultaneously view all crucial indicators. Conveniently, these charts offer options to print or download directly from the dashboard, accessible via a button in the top right corner.
Detailed Metrics
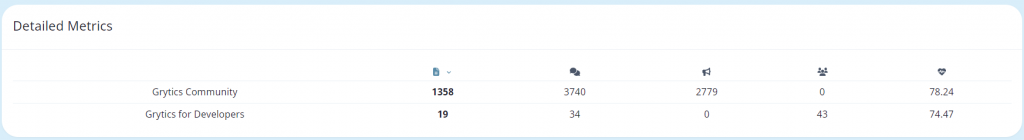
The detailed metrics available provide a comprehensive overview of each group's engagement and performance, including data on posts, shares, comments, and reactions. This data allows you to identify which aspects are driving engagement and activity within the groups.
With a simple click, you can sort groups according to specific metrics. Discover which group is most active in content creation (measured by 'posts' and 'comments'), which group is the most light-hearted (indicated by 'haha' reactions), and which group's posts have the widest reach (as shown by 'shares', especially relevant for public groups).
For record-keeping, you can easily export these metrics from the top right corner of the dashboard.
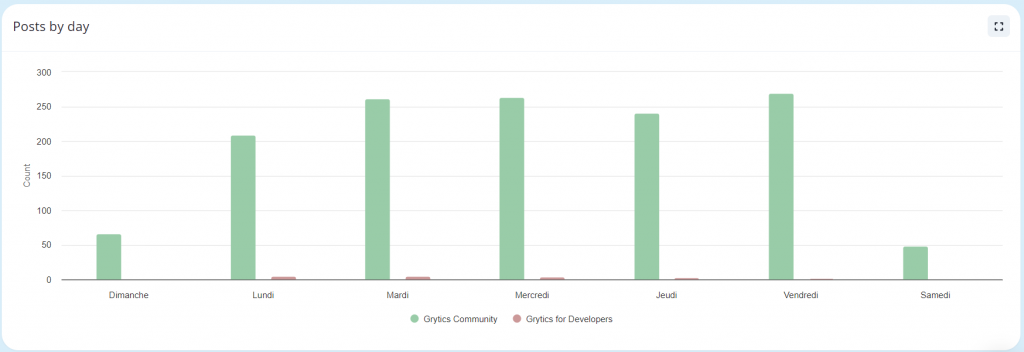
Posts & Comments by day
Additionally, the dashboard provides daily charts for posts and comments, enabling you to compare the volume of these interactions across different days of the week. This feature helps you pinpoint which groups are most active on specific days and observe any correlation between the number of posts and comments.
Similar to other features, these charts also include the functionality to download, accessible from the top right corner.
4. Best Practices and Growth Strategy Development
Once you've pinpointed the highest-performing groups and understood their success factors, it's time to extract best practices and formulate a growth strategy for your groups.
Consider these strategies as examples:
Should you notice that top-performing groups consistently show high volumes of posts, consider increasing your posting frequency to boost engagement. For instance, if these groups see heightened activity, particularly on Saturdays, with an increase in posts and comments, it would be strategic to schedule more content on Saturdays. Utilize the available Publishing Tools to efficiently schedule, manage, and monitor your posts all in one place.
Additionally, if these leading groups have a high volume of comments, delve into the most commented posts or review the post list to identify conversation-driving topics. This insight allows you to initiate similar engaging discussions in your groups, fostering more vibrant and active community interactions.
5. Continuous Monitoring & Enhancement
Benchmarking your groups is a vital, iterative process aimed at nurturing your community and advancing your business objectives.
Through group benchmarking, you not only identify the highest-performing groups but also gain insights into the reasons behind their success. You then implement these best practices and proceed to benchmark once more.
Adapt your benchmarking frequency to align with your specific goals and requirements. For instance, if you're establishing a performance barometer, consider benchmarking and tracking your groups' performance on a daily basis. Alternatively, if you manage groups for your business or clients, a weekly benchmarking approach offers agile management.
Stay committed to consistent benchmarking. Continuously observe, learn, and refine your strategies. In doing so, you'll cultivate a thriving online community and foster business growth.
Topics you may also like
Whether you need to conduct academic research, marketing study, or community inquiry, or you are looking for answers, suggestions, and practices, the Grytics Search Solution can help you make a successful investigation. Here are "5 Tips to Make a Successful Investigation via the Grytics Search Solution within Your Facebook Groups".
In conclusion, benchmarking your Facebook groups is an ongoing journey toward building a vibrant community and expanding your business. By consistently monitoring and improving based on your findings, you create a thriving environment that caters to your community's needs while achieving your business objectives. Remember, the key to success lies in understanding what works, implementing best practices, and being adaptable to change. Keep benchmarking, keep growing, and watch your Facebook groups flourish.